Introduction
This posting captures the steps performed with regard to optimizing the SharePoint 2013 search crawl interval for a customer farm. Content size includes approximately 100,000 items in two content databases, totaling approximately 60 GB. The customer farm has approximately 320 users, of which about 30% engage the farm on any given workday. Query usage is minimal. However, a number of new search-driven web parts have been implemented and other, content query web parts are being migrated to search-driven implementations. The move to search-driven web parts was precipitated by the migration to SharePoint 2013.
Originally, a crawl interval of 2 hours had been adequate. However, after the migration to 2013, the customer implemented search-driven web parts requiring more a current index. Before implementing a shorter crawl interval, a study was performed to examine crawl intervals and determine what the optimum crawl interval would be.
Much more data was collected then presented here. This posting presents just the most salient charts and data that was collected. The study found that a crawl interval of 30 minutes was optimal for the customer content. Further decreases in the crawl interval did not realize any significant gains in crawl freshness - neither did the use of continuous crawling.
Procedure
- Determine baseline
- Configuration
- Full crawl: weekly on Sundays 10:00 PM.
- Incrementals: daily, M-F, every 2 hours, 7:00 AM - 6:00 PM
- Topology

- Application Server Performance
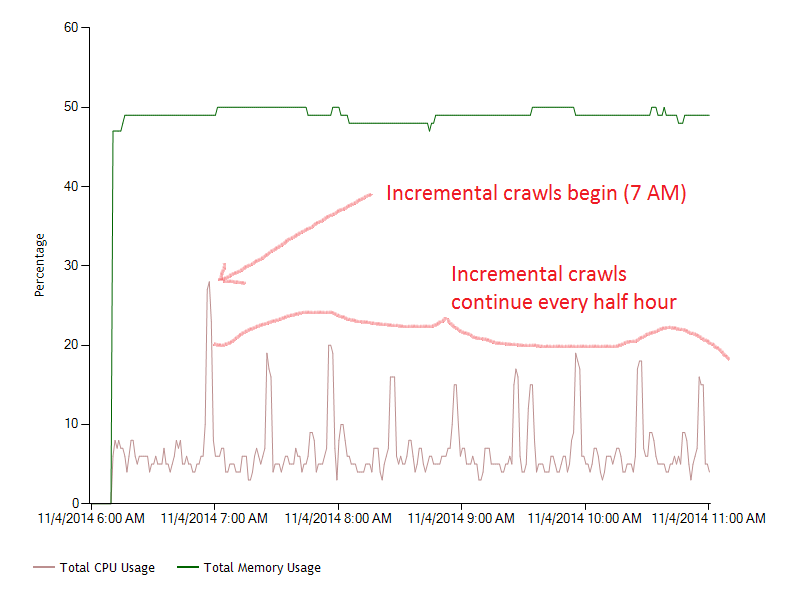
- Baseline: 2-hour Daily Incrementals
- CPU and Memory: the spikes are the semi-hourly incremental crawls. memory usage averages 50%. This allocation is not solely for crawl but is harnessed for all search system components.

- Processes

- Percentage CPU usage: Contrast NodeRunner memory usage in the above graph with CPU usage in this one:

- Analysis: these graphs showed reasonable application server resource usage. No issues.
- Baseline: Weekly
- CPU and Memory: These 8-day charts indicate a fairly reliable understanding of CPU and memory impacts of crawl component.

- Processes: There does seem to be a general upward trend in nodeRunner resource usage. I don’t believe that this is associated with crawl rate since the crawl rate has remained unchanged during this period. I suspect it is associated with increasing content size. Whatever the case may be, this deserves monitoring for its own sake as crawl rate is increased.

- Percentage CPU usage: CPU usage frequently peaks at 60% for full crawls. Incremental crawl peaks are peaking at 30%.

- Analysis: these results demonstrated to me that application server load was well within acceptable limits, and that these results were consistent.
- Performing Testing
- Test: 60-minute Incremental Crawls
- Process size
- Daily

- Percentage CPU usage
- Daily

- Weekly

- Crawl Freshness SummaryDistribution by freshnessContent SourceAggregate Freshness# Documents< 10 min< 30 min< 1 hour< 4 hours< 12 hours< 1 day< 2 days< 3 days> 3 daysLocal SharePoint sites< 1 hour15517%60%95%98%98%98%98%100%100%
- Analysis: No significant crawl-related adverse trends and impacts observed.
- Test 30-minute Incremental Crawls
- CPU and Memory
- Daily
- Process size
- Daily

- Percentage CPU
- Daily

- Crawl Freshness (over entire workday)SummaryDistribution by freshnessContent SourceAggregate Freshness# Documents< 10 min< 30 min< 1 hour< 4 hours< 12 hours< 1 day< 2 days< 3 days> 3 daysLocal SharePoint sites< 30 min20053%96%100%100%100%100%100%100%100%
- Analysis: no significant crawl-related adverse trends and impacts observed; content freshness improved.
- Test 15-minute Incremental Crawls
- CPU and memory

- Process size

- Percentage CPU Usage


- Crawl Freshness (over entire workday)SummaryDistribution by freshnessContent SourceAggregate Freshness# Documents< 10 min< 30 min< 1 hour< 4 hours< 12 hours< 1 day< 2 days< 3 days> 3 daysLocal SharePoint sites< 30 min8878%100%100%100%100%100%100%100%100%
- WFE Impacts

- Analysis: no significant crawl-related adverse trends and impacts observed; crawl processes seem now close to overlapping; no improvement in crawl freshness.
- Test 10-minute Incremental Crawls
- Crawl Freshness (over entire workday)SummaryDistribution by freshnessContent SourceAggregate Freshness# Documents< 10 min< 30 min< 1 hour< 4 hours< 12 hours< 1 day< 2 days< 3 days> 3 daysLocal SharePoint sites< 30 min24478%93%93%93%94%100%100%100%100%
- Analysis: no improvement.
- Test Continuous Crawl
- Crawl processes

- Crawl Freshness (over entire workday)SummaryDistribution by freshnessContent SourceAggregate Freshness# Documents< 10 min< 30 min< 1 hour< 4 hours< 12 hours< 1 day< 2 days< 3 days> 3 daysLocal SharePoint sites< 30 min4486%100%100%100%100%100%100%100%100%
- Analysis: no improvement.
- Determine Conclusions
Decreasing the crawl interval to less than 30 minutes led to no discernible improvement in crawl freshness. Implementing continuous crawl also did not improve crawl freshness. Given the results of testing, setting the crawl interval to 30 minutes accomplishes the best crawl freshness performance reasonably achievable for this system.
- Overview of search in SharePoint Server 2013
- Crawling content with Sharepoint 2013 Search
- SharePoint 2013 Search Architecture Part 1 - Intro
- Best practices for crawling in SharePoint Server 2013
- Working through the process of optimizing search crawling significantly improved my understanding of search crawl processes in general across the SharePoint distributed system.
No comments:
Post a Comment