Background
This procedure walks you through the process of scripting and implementing a very basic stored procedure for auditing SELECT queries against a SQL Server database. It does not implement any practical structured error trapping which is reserved for a future article. A copy of the entire script used in this article is available in the Resources section. You will use SQL Profiler to draft the framework for the script and then you will use SQL Query Editor to finish it up and implement it. Let's get started.
Procedure
References
- Start SQL Server Management Studio.
- From the Tools menu select SQL Server Profiler. A Trace Properties dialog will appear.
- Enter a name for the trace
- Check Save to file. A file Save As dialog appears. Navigate to the directory in which you want to store the output from this trace; enter a file name and then click Save.
- Check Server processes trace data. This completes configuration of the General tab.
- On the Trace Properties dialog select the Events Selection tab.
- On the Events Selection tab uncheck everything.
- Check Show all events and Show all columns.
- Scroll down the list of event groups until you come to the TSQL one
- Expand this event group to see its members
- Enter a check into SQL: StmtStarting. You may need to uncheck and then recheck it in order to have all of this event's properties also checked.
- Scroll across the list of columns until you see the TextData column. This property will contain the text of a SQL query triggering this event.
- On the Events column, select the SQL: StmtStarting event so that it is highlighted (as in the figure above).
- Now click Column Filters. The Edit Filter dialog appears. The left pane lists all of the properties associated with the event you selected.
- Scroll down this list until you come to the TextData property.
- Select the TextData property. The right pane updates to show you the filters that you can apply.
- Open up the Like filter and then enter: %SELECT%.
- Click OK. The Edit Filter dialog closes
- Click Run. The Trace Properties dialog closes and a new dialog appears listing events associated with the trace you created.
- In Microsoft SQL Server Management Studio select a table from any database, and then view the top 1000 rows (right-click on the table...). Now go back to the trace list. Scroll across until you see the TextData property. All of the events listed here involve the use of SELECT queries.
- On the SQL Server Profiler menu choose File > Export > Script Trace Definition > For SQL Server 2005 - 2008 R2. A Save As dialog appears.
- Navigate to where you want to save this script give it a name and then click Save.
- Stop the trace and then exit SQL Server Profiler. You're all done with this tool. Now go back to SQL Server Management Studio.
- From the File menu select Open > File with New Connection... An Open File dialog appears.
Navigate to where you saved your script (the file ends with .sql) select it. - Click Open. A new Connect to Database Engine prompt appears.
- Enter the appropriate authentication details and then click Connect. The script appears in a new query tab. Hang in there - you're almost done. Now let's do a little editing and cleanup.
- Remove the filter on SQL Server Profiler statements. You'll see it right after the one for the SELECT statement. This filter isn't really needed and serves no useful purpose. Just delete the whole line. Now let's build a better filename generator.
- Add the following script just after the BEGIN statement.
- Update the create trace stored procedure line with the new filename.
- These few lines of script you added create a new trace file every time the trace is started (such as after a shutdown). Now let's turn this into a new stored procedure.
- In Object Explorer open up the master database tree then open up Programmability, and then Stored Procedures.
- Right click on Stored Procedures and then select New Stored Procedure. A new Query Editor tab appears. In this Query Editor is a template for creating a new stored procedure. This needs a little editing.
- Delete the first comment block (it's going to be removed anyway). You can remove the first SET statement here as our trace procedure won't be performing any SELECT queries; and you can remove the second SET statement as we'll be using standard identifiers (single quote). Then add a few more lines like those shown below. The reason being that we want this stored procedure to be applied to SQL: StmtStarting events generated by any database, and thus you need to associate it with the master schema. The next thing to add is a quick check to make sure this procedure hasn't already been created: Fill out the second comment block as appropriate.
- Now copy everything from your trace script and then paste it in between the BEGIN and END statements in the CREATE PROCEDURE template. You should have something like that illustrated in the figure below.
- Remove the comment block just after the BEGIN statement. This was entered by SQL Profiler and serves no useful purpose.
- Click the Parse button, located on the toolbar. The Results window appears below the Query Editor window.
- Double-click the first line that you see in the Results window. The Query Editor window scrolls down to the location of the error associated with that line.
- Remove the go statement just after the finish: statement. This is what's causing the parse error. Once you remove this go statement, click Parse again. The parse will complete successfully.
- Click the Save button in the toolbar. The Save As dialog appears. Enter a name for the trace and then click Save.
- Click the Execute button on the Management Studio toolbar. This creates the stored procedure.
- In Object Explorer, right click on any folder and then select Refresh.
- In Object Explorer, open up the tree to master/Programmability/Stored Procedures. The new stored procedure you just created will be listed below the System Stored Procedures. Good Job! I bet you didn't think you could get this far. Now, the last task is to have SQL Server run the stored procedure and configure SQL Server to automatically start this procedure on startup.
- Open a new Query Editor window.
- Enter the SQL statements shown below.
- Click the Execute button. A new Results window appears below the script presenting the Trace ID of the trace that was started. In this case the trace has an ID of 2.
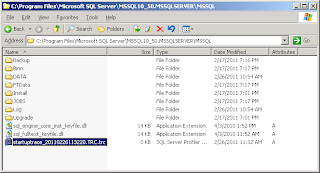
- Go to the directory in which this trace file was created and you should see it listed there.
- Now let's test our script. If you shutdown and restart your SQL Server instance, a new trace file should be created.
- Shutdown and restart SQL Server, and then refresh the directory window where the trace file is being written to. A second trace file appears.
- The next and final test is to see what events are captured by the trace. To do this simply execute a read against any table.
- Right-click on a table, and then choose Select Top 1000 Rows. This executes a SELECT query against the selected table.
- Double-click on the trace file to start SQL Server Profiler. In a results window you will see listed all of the events that were captured. All of these events should involve a SELECT query, as shown in the figure below.
- Congratulations! You have successfully created a script that captures all events involving any reads of any database in your Microsoft SQL Server instance.
- A copy of the entire script is available below.


- The method discussed here can be applied to any TSQL query that you may want to audit.
- I've used SQL Profiler as a tool to build some of the script for me but you can of course script everything out manually in SQL Query Editor. SQL Profiler is a good tool to use if you're just starting out with scripting traces, since it scripts most of the significant parts for you. The only thing it doesn't do for you is implement some good structured error trapping, but you can do this yourself using the Try... Catch structure.
- Microsoft SQL Server 2008: Common Criteria Certification
- Common Criteria Compliance Trace Script
- Basics of C2 Auditing (requires registration - free)
- Automatically Running a Process When SQL Server or SQL Agent Starts
- Sample Databases for Microsoft SQL Server 2008R2 (SR1)
- Get Compliant with SQL Server 2005 Audit Logging
USE master
GO
IF OBJECT_ID('dbo.csp_MyAuditTrace') IS NOT NULL
DROP PROC dbo.csp_MyAuditTrace
GO
-- =============================================
-- Author: Al's Tech Tips
-- Create date: 02/26/2011
-- Description: Audits use of SELECT queries
-- against any database
-- =============================================
CREATE PROCEDURE dbo.csp_MyAuditTrace
AS
BEGIN
-- Set the filename for trace data capture
DECLARE @FileName nvarchar(256)
DECLARE @MyDateTime varchar(30), @instanceroot nvarchar(256)
SET @MyDateTime = CONVERT (nvarchar (30) , GETDATE(), 20)
SET @MyDateTime = REPLACE(@MyDateTime, '-','')
SET @MyDateTime = REPLACE(@MyDateTime, ' ','')
SET @MyDateTime = REPLACE(@MyDateTime,':','')
-- Get the instance specific LOG directory
-- Get the instance specific root directory.
SET @instanceroot = ''
EXEC master.dbo.xp_instance_regread N'HKEY_LOCAL_MACHINE',
N'SOFTWARE\Microsoft\MSSQLServer\Setup', N'SQLPath', @instanceroot OUTPUT
IF @instanceroot = '' OR @instanceroot = NULL
BEGIN
-- Exit the procedure
raiserror ('Could not obtain the instance root directory using xp_instance_regread.',
18,127)
return(1)
END
-- Prepare the Trace file.
IF SUBSTRING(@instanceroot, Len(@instanceroot)-1, 1) != '\'
SET @instanceroot = @instanceroot + '\'
SET @FileName = @instanceroot + 'startuptrace_' + @MyDateTime + '.TRC'
-- Create a Queue
declare @rc int
declare @TraceID int
declare @maxfilesize bigint
set @maxfilesize = 5
exec @rc = sp_trace_create @TraceID output, 2, @FileName, @maxfilesize, NULL
if (@rc != 0) goto error
-- Client side File and Table cannot be scripted
-- Set the events
declare @on bit
set @on = 1
exec sp_trace_setevent @TraceID, 40, 7, @on
exec sp_trace_setevent @TraceID, 40, 55, @on
exec sp_trace_setevent @TraceID, 40, 8, @on
exec sp_trace_setevent @TraceID, 40, 64, @on
exec sp_trace_setevent @TraceID, 40, 1, @on
exec sp_trace_setevent @TraceID, 40, 9, @on
exec sp_trace_setevent @TraceID, 40, 41, @on
exec sp_trace_setevent @TraceID, 40, 49, @on
exec sp_trace_setevent @TraceID, 40, 6, @on
exec sp_trace_setevent @TraceID, 40, 10, @on
exec sp_trace_setevent @TraceID, 40, 14, @on
exec sp_trace_setevent @TraceID, 40, 26, @on
exec sp_trace_setevent @TraceID, 40, 30, @on
exec sp_trace_setevent @TraceID, 40, 50, @on
exec sp_trace_setevent @TraceID, 40, 66, @on
exec sp_trace_setevent @TraceID, 40, 3, @on
exec sp_trace_setevent @TraceID, 40, 11, @on
exec sp_trace_setevent @TraceID, 40, 35, @on
exec sp_trace_setevent @TraceID, 40, 51, @on
exec sp_trace_setevent @TraceID, 40, 4, @on
exec sp_trace_setevent @TraceID, 40, 12, @on
exec sp_trace_setevent @TraceID, 40, 60, @on
exec sp_trace_setevent @TraceID, 40, 5, @on
exec sp_trace_setevent @TraceID, 40, 29, @on
exec sp_trace_setevent @TraceID, 40, 61, @on
-- Set the Filters
declare @intfilter int
declare @bigintfilter bigint
exec sp_trace_setfilter @TraceID, 1, 0, 6, N'%SELECT%'
-- Set the trace status to start
exec sp_trace_setstatus @TraceID, 1
-- display trace id for future references
select TraceID=@TraceID
goto finish
error:
select ErrorCode=@rc
finish:
END
GO
1 comment:
Great article! this helped me do exactly what I needed. And I learned a little something in the process
Post a Comment